


How do I turn data into decisions? Idle time example
Understanding the Impact of Idle Time
Here’s a real-world example from a large fleet customer that highlights how idle time can affect operating costs.
Over the past year, their average idle time increased from 18% to 23%. This change led to a rise in idle fuel usage from 174,000 to 190,000 Liters, resulting in an extra $29,000 in fuel costs.
This trend gave the customer valuable insights and prompted a deeper look into the data — exploring factors like site conditions, operator habits, and environmental influences that may be contributing to the increase.
By identifying these patterns, the customer is now better equipped to take action and reduce unnecessary idling across their fleet.
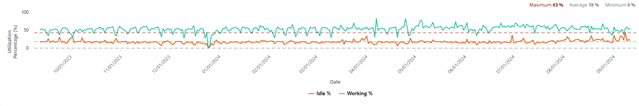
Figure 1: Utilisation from September-2023 to September- 2024
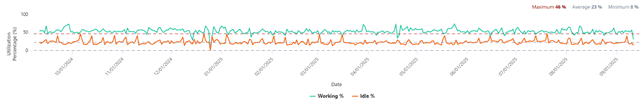
Figure 2: Utilisation from September-2024 to September- 2025
Fleet-Wide Insights: Identifying Opportunities for Improvement
Out of 161 reporting machines, 88 units (55%) exceeded the industry idle time target of 25%.
The chart in Figure 3 shows a clear view of idle time across the fleet.
This data helps customers pinpoint where machines may be underutilised — making it easier to take action, improve efficiency, and get more value from every asset.
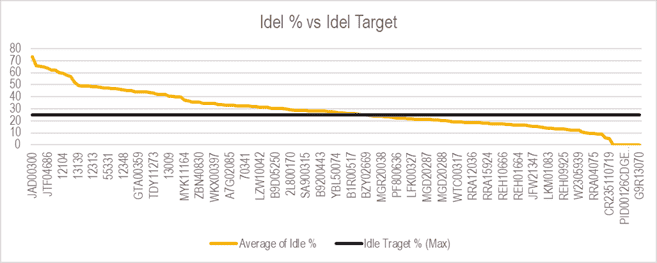
Figure 3: Idle % vs Target of a large fleet customer
Site-Level Analysis: Measuring Idle Time Against Targets
To better understand how actual idle time compares to your target, we use the formula:
(Idle Time ÷ (Idle Time − Target)) × 100
This gives a clear percentage showing how far operations are from the ideal benchmark.
A higher result means more over-idling — highlighting areas where efficiency can be improved.
Looking at idle performance by site helps uncover operational patterns and supports smarter decision-making.
Figure 4 shows a site-by-site analysis from a large fleet customer, offering valuable insights into where improvements can be made.
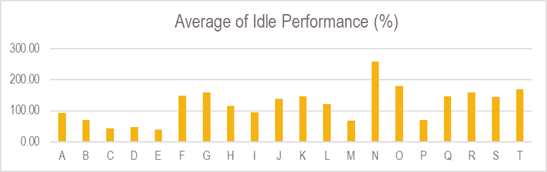
Figure 4: Site wise Idle performance
Digging Deeper: Understanding Idle Time from Every Angle
With VisionLink, you can explore idle time across your fleet in a variety of ways to uncover hidden inefficiencies:
- By machine type – See how different equipment families compare
- By site, shift, or date – Track idle time for individual machines in specific conditions
- Idle fuel cost – Understand how much idling is costing you in fuel
- CO₂ emissions – Measure the environmental impact of idle time
- Excessive idle events – Identify machines that idle more than expected
To reduce unnecessary fuel burn, it’s important to look at all the factors that contribute to idle time. Often, the biggest inefficiencies come from site-specific conditions, operator habits, and environmental factors.
That’s why it’s essential to have clear policies and procedures tailored to each site — and to regularly review machine idle hours to see if your strategies are working.
While idle time between 25% and 30% is generally considered normal depending on site conditions, going beyond that can lead to higher fuel costs and increased wear on your machines.
This is where VisionLink becomes a powerful tool. It doesn’t just track idle time — it gives you the insights you need to work with your team, your dealer, and Caterpillar to reduce inefficiencies and improve overall fleet performance.